Plus: how to equitably approach FPO payouts.
April 15, 2021 by Andrew Fish in Analysis

This is the second in a two-part series on the cost of being a touring disc golf professional. Part 1 explores the estimated cost of touring for a full season; it is recommended that you read it first before continuing below.
Having established baselines for the cost of touring, my next topic of interest is to try to estimate how well players would need to play throughout the year in order to break even on their tournament winnings alone. It’s relevant to note again here that players who are sponsored because of their touring (so, above an ambassador-type level) likely receive some combination of stipends, tour series discs, entry fee payment, performance bonuses, gear, discs, and promotion, so this is more for the kind of player you see while scrolling down tournament leaderboards, or trying to find a bargain pick for fantasy and muttering “wow, how’s he still on tour?” But, in theory, this could also be thought of as how much a player would need to receive from her sponsor to stay on tour in the absence of winnings, other income, or some combination of the two.1
The methodology for estimating expected winnings takes a little bit of squinting and a little bit of willing belief (yuck), but I think it’s still good enough for a reasonably solid guess. Here’s what I did:
- I found the closest equivalent previous event to each 2021 stop on the hypothetical tour schedule from Part 1.
-
- For most, this was the 2020 event.
- For events that didn’t run in 2020, but had in 2019 with a similar format, I used the 2019 version.
- For new events (OTB Open), I used a placeholder that would have a similar payout (in this case, the 2019 SFO).
- For events whose tier or advertised added cash is upgraded from previous years, I used it anyway.
-
- I took the average round rating from each cashing player at the event. For 10-point rating increments (FPO 920-1000, MPO 1000-1080), I transcribed to a spreadsheet how much cash a hypothetical player dropped into that event and scoring exactly that rating would have won. I just assumed the hypothetical player took the place of whatever player was listed in the results and didn’t recalculate the payout table or percentage of added cash.
- Then I took the sum of all those expected winnings at each event. So, an MPO player who averaged 1000 at each event and only played US tour events would expect to win SUM(363 + 380 + 0 + 293….) = $7615 in 36 events.
- Then for the “types” of players I laid out in Part 1, I referenced their expected cost of touring and used a linear interpolation between the appropriate winnings referenced to 10-point ratings increments, and computed the rating that would correspond to that expected winnings amount. A woman who played in FPO, traveled solo in a van, only camped, and went to Europe would have an expected tour cost of $18,300. In order to make that much on winnings alone, she’d have to average 947 throughout the whole tour.2
This is not a perfect approach. Here are some of the issues with how I’ve structured my estimates:
- The biggest, most obvious thing is that tournament fields and purses are not equal, year-to-year, and my best estimates until full registration lists and payout tables go up are from 2019 and 2020. Most, especially those being added to the tour, will tend to grow in field size and purse. This suggests that the potential payouts will be greater in 2021, but it’s also possible that increased depth of competition will mitigate the bounty by making it harder to cash or finish near the top. The PDGA payout tables route high payouts to the top end, with a long, flat tail near the end of the payout structure. As such, one big win or high finish might be better for a player’s wallet than a handful of decent ones.
- A nearly equally big, nearly equally obvious thing is that round ratings do not necessarily represent equivalent performances from course to course. Some courses don’t spread players out well. Others spread players out hugely. Some give very high ratings; some give very low ratings. For example, Matt Bell won the 2019 Delaware Disc Golf Challenge, an NT, in MPO with an average round rating of 1038.7. That same average round rating would have placed him in 16th place at The Memorial Championship (a DGPT event) in 2020. The field was probably a little bit weaker at DDGC coming right after Worlds, but certainly not such that 15 players not in attendance would be expected to finish ahead of the MPO winner. Diving deeper into the ratings system is a far larger scope, for someone else to tackle in another article series.
-
- I chose to use average round rating because the best apparent alternative was finishing place. Tournament field sizes and payout depths may vary widely and I have no real way of controlling for that in essentially an observational study. In order to present the findings simply, it felt more relatable to say “you need to average 945 in order to break even” than “you need to average first place at B-tiers, second place at A-tiers and Silver Series, fifth place at Pro Tours, fourth place at NTs, and seventh place at Majors in order to break even.”
- If you only look at individual events or at the extremes of the data, this methodology might be a little bit spurious. I’m assuming that over enough events, the assumed round rating in order to break even stacks up okay. It’s a similar premise as an individual round rating being suspect, but a season’s worth of data giving us a pretty accurate “player rating.”
- The extremes probably won’t matter too much. The player who is winning the event is almost always doing way better than break-even. For the purposes of this study, we’re more interested in the tipping-point rating to be reasonably sure of covering costs.
-
- The scales I used went up to 1000 for FPO and 1080 for MPO. There were some events (for example, Paige Pierce at the 2020 Preserve Championship averaged 1009) where even the high end of the scale wouldn’t net first place cash. There were also others where the division winner “only” averaged 1043 or 961–so in that case hypothetically shooting an 1100 average doesn’t net more winnings than 1050. Again, this probably doesn’t matter that much since this is about breaking even, not setting all-time winnings records.
- Since I had to make several assumptions in order to get to expected costs, extending into ratings may or may not result in additional assumptions or compound minor errors.
With all this in mind, let’s take a look at break-even performance levels for different approaches to touring:
MPO Player, Traveling Solo
| Travel Decisions | Target Winnings | Approx. Target Rating |
|---|---|---|
| Camping Only, Car | $13,500 | 1011 |
| Add Europe | $17,400 | 1017 |
| Add Van | $15,600 | 1014 |
| Add Van + Europe | $19,100 | 1020 |
| Add Lodging | $19,800 | 1021 |
| Add Lodging + Europe | $23,100 | 1024 |
FPO Player, Traveling Solo
| Travel Decisions | Target Winnings | Approx. Target Rating |
|---|---|---|
| Camping Only, Car | $11,700 | 934 |
| Add Europe | $16,600 | 943 |
| Add Van | $13,700 | 938 |
| Add Van + Europe | $18,300 | 947 |
| Add Lodging | $18,000 | 947 |
| Add Lodging + Europe | $22,200 | 955 |
2 MPO Players Traveling Together (Per Person)
| Travel Decisions | Target Winnings | Approx. Target Rating |
|---|---|---|
| Camping Only, Car | $11,900 | 1008 |
| Add Europe | $14,900 | 1013 |
| Add Van | $12,900 | 1010 |
| Add Van + Europe | $15,800 | 1015 |
| Add Lodging | $15,100 | 1013 |
| Add Lodging + Europe | $17,800 | 1018 |
2 FPO Players Traveling Together (Per Person)
| Travel Decisions | Target Winnings | Approx. Target Rating |
|---|---|---|
| Camping Only, Car | $10,100 | 931 |
| Add Europe | $14,100 | 938 |
| Add Van | $11,100 | 933 |
| Add Van + Europe | $15,000 | 940 |
| Add Lodging | $13,200 | 937 |
| Add Lodging + Europe | $16,900 | 944 |
MPO + FPO Players Traveling Together (Per Person)
| Travel Decisions | Target Winnings | MPO Approx. Target Rating | FPO Approx. Target Rating |
|---|---|---|---|
| Camping Only, Car | $11,100 | 1006 | 933 |
| Add Europe | $14,400 | 1012 | 939 |
| Add Van | $12,000 | 1008 | 935 |
| Add Van + Europe | $15,300 | 1014 | 941 |
| Add Lodging | $14,100 | 1012 | 939 |
| Add Lodging + Europe | $17,300 | 1017 | 945 |
At first glance, the target winnings may seem surprisingly low, compared to what many touring players show on their PDGA page. This is true but misleading. This study essentially assumes that a player plays for 35+ consecutive weeks. A player would need to be genuinely crazy to do that. Eventually, we all need a week off of driving, of practicing, of competing. Even some stalwart road warriors of the last decade appear to be backing off of weekly competition, likely because enhanced sponsorship benefits enable them to be pickier about their tournaments in order to peak at the events they really care about.
One wildcard event that I don’t have a neat way of including is the DGPT Tour Championship event, where players do pay a registration fee but are basically paid more than double that just for showing up and playing the first round, even if they get eliminated immediately. That’s obviously enticing on its own, but the payouts for advancing (or, dare one even think about it too early, winning?) are potentially season-changing. So (because basically every player on tour would be prepared to enter the event) although I included the travel, lodging, and entry fee to the event throughout all other steps of this study, that calendar entry remains a big unscratched lottery ticket for every touring pro, one for which it’s probably worth going to all the DGPT and Silver Series events. That said, as the ratings necessary just to break even on tour would indicate, one doesn’t necessarily have to be among the top 16 or 32 players qualifying for the DGPT finale to viably be on tour–so perhaps taking out that $300 or so from the expected costs would also be valid.
Also recall that, as I noted in part 1, the “costs” of touring are exclusive of what a player would be expected to spend if they were living at home and not traveling at all. So even some basics, like car insurance, health insurance, phone bills, hygiene items, clothes, and shoes, may still be significant recurring costs.3
There’s still a fairly high barrier to starting a tour: first, you’ve got to be a scratch golfer in your division, able to compete well regionally in C, B, and A-tiers. The choice to hit the road for most players likely is more about the experience than seeing it as a lucrative career path. To get started, you’d certainly need reliable wheels, the nest egg savings to float an awful lot of entry fees early in the year, and enough extra discs, shoes, clothes, and food in case it takes a few tournaments to get on track. In addition, you’d need to have either a supportive home structure or no one else depending on your presence or income for their well-being.
However, there are plenty of side hustles a player could get into–selling discs, teaching clinics, various gig or remote work, day trading, or street magic–to offset their expenses beyond just tournament winnings. But, in summary, it seems like if you have enough saved up that you could live at home for a year, the threshold for mere survival on the road isn’t shockingly, unattainably high.
One really interesting thing I didn’t set out to find but uncovered through the course of this study is just how much lower the upside is to being an FPO player vs. the expected costs. The only appreciable difference in touring costs between men and women are food (about $55/month from my assumptions) and entry fees. Many tournaments give FPO entrants a $25-$50 reduction in entry fee over the MPO fee, ostensibly to lower the barrier to entry and encourage more FPO players to sign up. Without a completely different study angle, I have no way of evaluating whether this works. However, I have a suspicion that, unless TDs are specifically accounting for the disparity and subsidizing the FPO entry fees when they calculate the added cash distribution4, the smaller number of entrants in the FPO division and smaller relative entry fees create a double whammy in FPO players’ ability to make a net profit.
Take, for example, an MPO and FPO player, each traveling solo, and the approximate rating they have to keep just to stay on the road:
| MPO, Traveling Solo | | | FPO, Traveling Solo | |||||
|---|---|---|---|---|---|---|---|
| Travel Decisions | Target Winnings | Approx. Target Rating | EOY Rating Rank (2020) | | | Target Winnings | Approx. Target Rating | EOY Rating Rank (2020) |
| Camping Only, Car | $13,500 | 1011 | #141 | | | $11,700 | 934 | #29 |
| Add Europe | $17,400 | 1017 | #97 | | | $16,600 | 943 | #17 |
| Add Van | $15,600 | 1014 | #118 | | | $13,700 | 938 | #21 |
| Add Van + Europe | $19,100 | 1020 | #74 | | | $18,300 | 947 | #15 |
| Add Lodging | $19,800 | 1021 | #69 | | | $18,000 | 947 | #15 |
| Add Lodging + Europe | $23,100 | 1024 | #53 | | | $22,200 | 955 | #9 |
Those are pretty extreme differences! The 141st highest-rated man in the world essentially has the same ability to get to the baseline tournament winnings to stay on tour as the 29th highest-rated woman (the world champion as recently as 2018). A touring player in MPO only needs to be the 97th-best player by rating to afford a full touring season and a trip to Europe, but a touring player in FPO needs to be 17th or better in the world.
The ratings system was originally set up with an intent of 1000 being a “scratch” men’s golfer. Since all players, regardless of gender, age, or amateur/professional status, are evaluated on the same ratings scale, it’s hard to determine how to scale men to women, to say what a scratch women’s golfer would/should be rated. As a rough estimate loosely based on the average difference between tournament-winning rating averages, I’ve assumed that 1000 for an MPO player roughly equals 920 for an FPO player. This is arbitrary, and the marginal increase in expected winnings vs. rating for MPO and FPO players is far more salient. Hence, I’ve set those two equal in the following charts, and then compared at 10-point player ratings increments thereafter.
As seen in the chart below (US travel only), pretty much no matter how well an FPO player plays on average, they can’t ever reach $50,000 in tournament winnings in a year. Recall that Paige Pierce set in late 2020 a new FPO record player rating at 991. That’s roughly equivalent to the T-8th best men’s player’s expected winning potential at 1040 over a full touring season:
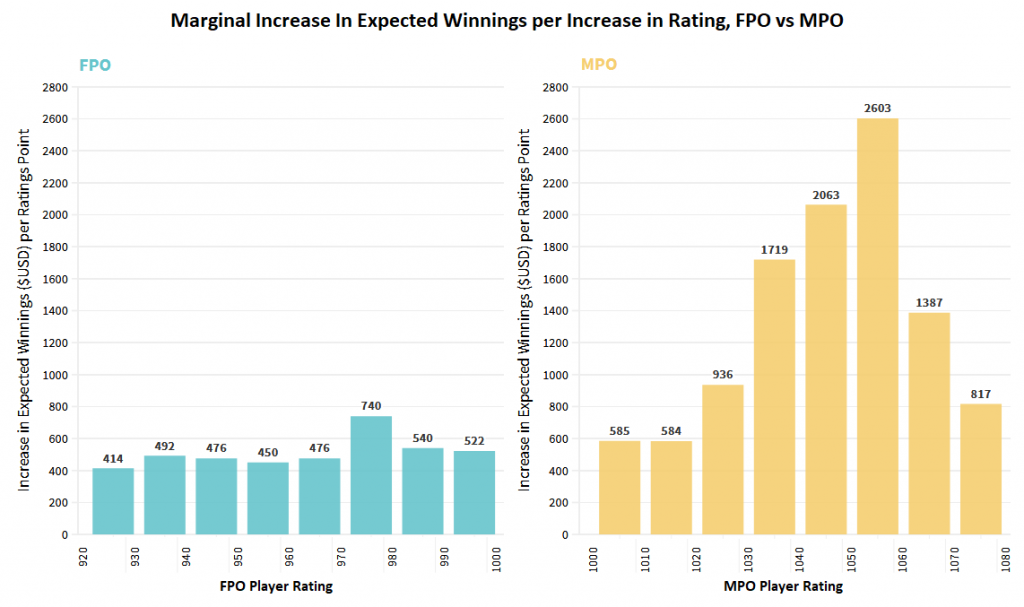
It’s also apparent from the previous chart that not only are women limited in potential tournament winnings, the growth of their expected winnings as a function of rating (itself a proxy of how well a player performs over the season) is much flatter than men of an equivalent rating. The following chart shows that for every ratings point increase from 920 to 970, the additional expected winnings for a woman playing every tour event in FPO is less than +$500.5
Compare that to a man playing every tour event in MPO–the 920-rated FPO player would win about $5800 over a full season, while a 1000-rated MPO player would win about $7615–not that different relative to breaking even after accounting for entry fee differences. But his expected marginal winnings increases far more rapidly per marginal ratings point! From 1000 to 1020, it’s consistently about +$585 per ratings point, then skyrockets to +$936 between 1020 and 1030, +$1719 between 1030 and 1040, +$2063 between 1040 and 1050, and +$2603 between 1050 and 1060, before tailing off above that. Sometimes at a tough tournament field, the commentators will say that “every stroke counts” — indeed, projected over the course of the season, the strokes add up to some real cash (perhaps more real in MPO than FPO).
It’s well known and documented that the percentage of women registered as PDGA members and participating in PDGA events (and, less quantifiably, in disc golf participation as a whole) lags well behind men’s registration and participation. There are numerous societal factors well outside the scope of disc golf impacting those participation rates, so it’s unrealistic to expect that any one change in tournament or touring practices would “solve” the problem.
Since the PDGA payout tables are top-heavy, there is a big incentive to dramatically outperform the rest of your field. Since the added cash distribution splits at least the minimum added cash proportionally based on percentage of entry fees brought in, with TD discretion above that, there is a big incentive to play in larger divisions. And, perhaps reductively, there’s a big incentive to be above the cash line. In late 2017, some top FPO players advocated for flatter and deeper payouts to enable more players to stay on the road, and that feedback appears to have been heard and answered in various degrees. For example, the PDGA announced that in 2021 the NT bonus structure would include equal payouts place-by-place for men and women. Similarly, in 2020, the DGPT Championship had essentially equal payouts to qualifying participants in both MPO and FPO, and the DGPT has been paying 50% of the FPO field while only paying out 40% of the MPO field.
After delving into the real (assumed) costs of touring for a full season, and then trying to determine what level of performance it takes to stay on tour, I think I’ve reasonably concluded that there are structural limitations to women being able to join the tour (for example, not having enough spots reserved) and stay on tour (when shallower payout tables are used or the added cash distribution is strictly tied to percentages of entry fees and/or entrants) or attain the same incentives beyond just payouts (for example, developing a personal fan base by being featured in media coverage as frequently on large channels).
Projecting forward, the essentially fixed costs for anyone touring, but a greater financial (and media) upside to MPO players suggests that, as prospective touring players weigh their opportunity costs, more men than women not currently on tour will elect to travel and play disc golf professionally. This results in a vicious cycle wherein there aren’t enough additional potential FPO entrants to result in larger payouts, and the payouts aren’t enough to incentivize more women to go on tour. This conundrum isn’t unique to the professional tour—it plays out at all levels of women’s disc golf. For women looking to become touring professionals, regionally or worldwide, there’s a significant barrier in the form of far lower winnings potential, both for marginal improvement and overall, than an equivalently-talented man.
As such, I would recommend that the PDGA, DGPT, tournament directors, and the disc golf community at large6 explore some or all of the following steps, in order to equilibrate the ability of FPO players to remain on tour to MPO players:
- Save far more spots for women’s divisions than you think you need. Tournaments with pre-registered strong and deep women’s fields are likely to incentivize more women to come who didn’t already plan on it.
- After meeting the PDGA standard of added cash proportionate to entry fees brought in, add a larger percentage of added cash to women’s fields.
- Even if paying out 40% or 45% in men’s divisions, extend the cash line in women’s divisions to 50%. Paying out deeper and flatter based on the payout tables tends to support the players squeaking by on tour, especially since the regular top finishers have numerous other sources of income or subsidization. As noted previously, the DGPT has been paying out 50%; however, this pattern may not extend across all tiers.
- A bolder option would be to pay, place by place, the same in FPO as in MPO until the cash line.
- Sponsors provide greater help to FPO players on tour, as well as incentivizing regional players who could be competitive, to travel and play more.
Those recommendations, I realize, will be heard and quickly dismissed by many. A common defense of greater participation among men, and more coverage and higher payouts in the MPO division, is that there’s already more interest there. That’s true, there currently is. The existing systems for added cash distribution, registration, and media practices are set up to keep it that way by throwing additional marginal resources at the already-stronger MPO division in the name of growth and viewership.
Long-term, this will only serve to widen the opportunity gap between MPO and FPO players, putting women’s disc golf, and women who want to play professional disc golf, at an even greater structural disadvantage. While disc golf and the professional tour are still in a growth phase, now would be the right time to implement and then regularly reconsider how to provide equitable opportunities to players regardless of their gender.
There shouldn’t be any need to explore tax liability, since all of these winnings, if reported as income, would also have equivalent expenses for entries, travel, and lodging. ↩
from 940 + [(18300-15176)/(20088-15176)] * [(20088-15176)/(950-940)], which rounds up to 947. ↩
If someone wants to take a stab at estimating how those would affect target winnings and thus target ratings to break even, go right ahead. And if you think you have some improvements to further validate these models or methods, I’ll be happy to give you a copy of the spreadsheet. ↩
Note 2 of the 2021 Tour Standards states that “the Required Minimum Added Cash to the Pro Purse MUST be spread across ALL Pro divisions based on the percentage of entry fees brought into the event by each division as per the PDGA Tournament Manager payout screens. Example: if the MPO division brought 50% of all Pro entry fees into the event, the MP40 division brought 30% of all Pro entry fees into the event, and the FPO division brought 20% of all Pro entry fees into the event, then MPO would receive 50% of the required Added Cash, MP40 would receive 30% of the required Added Cash, and FPO would receive 20% of the required Added Cash. Note: This Pro Added Cash distribution is automatically calculated for TDs by the Tournament Manager application once they input the Added Cash for their event into the Finance section.” ↩
$414, $492, $476, $450, $476 ↩
Although this article has been focused on the cost of touring, the same recommendations would and should apply at the local and regional levels, because it would be very challenging to produce tour-ready prospective FPO players without a structure of smaller tournaments to learn and practice in, and field sizes and payouts that make the competition personally and financially worthwhile. ↩