A tweak to putting stats has changed our previous analyses
June 20, 2019 by Aaron Howard in Analysis

The loyal readers of Ultiworld Disc Golf know that I have spent a lot of time investigating the roles of long (driving) and short (putting) distance accuracies in player success. For the uninitiated, feel free to review my previous articles for the details, but the basic idea is put succinctly in the title of this article. Driving is more important than putting is to scoring well.
However, all of my analyses were carried out in 2018, and at the beginning of the 2019 season, UDisc announced a new stat, C1X putting, because in their own words: “Professional disc golfers rarely miss a tap-in and we wanted a new stat that excluded these easy putts. The new Circle 1X Putting stat eXcludes tap-ins to help provide a clearer picture of putting skill.”1
From this, some people could easily hypothesize that my previous results are wrong, or at least incomplete, because they were based in part on C1 putting, which may not actually reflect putting skill. And I would be inclined to agree with those people.
So let’s test this hypothesis. Were my previous results wrong? If we use C1X putting instead of C1 putting does short distance accuracy explain player success more than long distance accuracy?
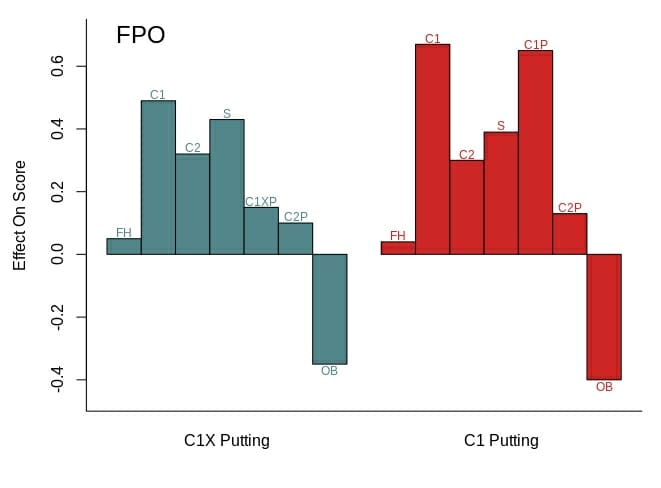
Well, the short answer to these questions is no.2 For example, in FPO, with every percentage point increase in C1X putting scoring improves by 0.15 strokes. Whereas, with each percentage point improvement in C1 in regulation scores improve by about half a stroke.
In general, for both MPO and FPO, hitting C1 or C2 in regulation are each at least 2 times more important than C1X or C2 putting. These results are consistent with those from my previous analyses. Tee-to-green trumps putting.
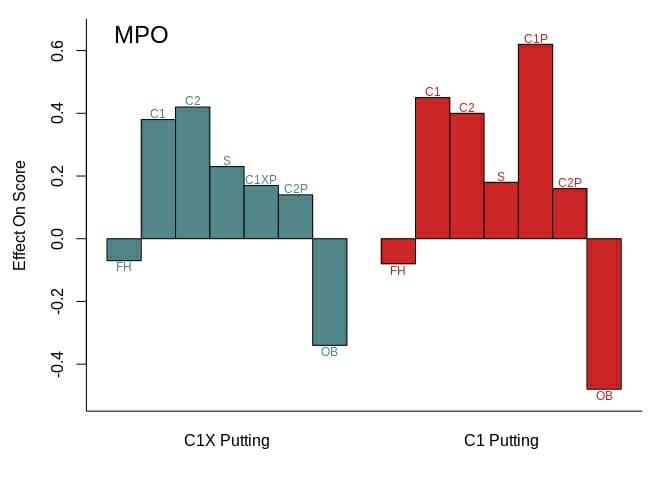
But what is perhaps more interesting is that my results indicate C1X putting is worse, by a large margin, than C1 putting at explaining player scores.
Hopefully, you noticed in the plots that there are two sets of results for both MPO and FPO and that’s because I ran one analysis for each division using C1X putting and another using C1 putting.3 Most of the results from the two sets of analyses are consistent. It’s an interesting tidbit that both scrambling and hitting fairways seems to be more important for FPO than MPO.
But, what I want to focus on is C1 putting. What does it mean that C1 putting has a larger effect on scoring than C1X putting?4 Well, it means that C1 putting is a lousy measure of putting skill.
Let’s think about this using a hypothetical scenario. Imagine you go out and play a round of disc golf and you have the best driving day of your life. You park every hole and have to avoid hitting your head on the baskets while putting out. In this hypothetical scenario, your C1 putting is 100%, but that 100% does not mean you had an amazing putting day. It actually means you had an amazing day from the tees! Now, this is an extreme example, but the concept holds. Standard C1 putting reflects tee-to-green ability along with putting ability, and that is why it has a larger statistical effect on scores than C1X putting.5
These results indicate it was a good idea for UDisc to convert C1 putting to C1X putting because it does a much better job of exclusively quantifying putting ability. And to bring everything back to the start of this article, I think it is for this same reason that analyses using C1X putting data do a better job of validating my previous findings regarding the primacy of long over short distance accuracy.
Interestingly, they also retroactively altered results from all previous tournaments to display only C1X putting results. ↩
Results are based on Lasso regressions using scores from the PDGA and statistics from UDisc for 50 MPO and 49 FPO events. I ran separate models for MPO and FPO, and one for each division using C1X putting and C1 putting. Lasso regressions are good to use for analysis like these that have many similar statistics (which could result in multicollinearity). Something like this type of analysis was first used in sports for the NBA. The regressions I ran were also mixed models where I controlled for the influence of each tournament on score. ↩
The C1 putting analyses only include results through the 2018 season because UDisc switched all stats to C1X putting at the start of 2019. ↩
It also has a much larger effect than any other variable in the C1 putting analysis. But it does not have a larger effect than the cumulative one of FH, C1, C2, and OB. All of which are certainly measures of long distance accuracy. ↩
I do not actually trust the results of the C1 putting analysis because it suffers from larger effects of multicollinearity, which is minimized by using the Lasso regression, and more severe breaking of the additivity assumption than the C1X putting analysis. ↩