Analytics like Elo ratings open up alternate ways of understanding and comparing pro player performance
February 13, 2018 by Aaron Howard in Analysis with 0 comments
Many of us who are interested in disc golf would love to see the sport enter the mainstream, and the sport seems to be moving in the right direction thanks to the ever-growing PDGA membership base.
However popular disc golf is becoming, it is generally lacking in one area that professional sports in which the NBA, PGA Tour, and, particularly, MLB have excelled recently: analytics. There has been growth in this area recently with the statistics provided by UDisc Live, and PDGA ratings have been around for a while. But, generally speaking, disc golf has some catching up to do when it comes to using big data to push our understanding of the sport forward.
I hope to help with the genesis of Elo ratings for professional disc golfers. Elo ratings are a simple mathematical tool used for comparing players.1 They have become popular for comparing teams or individuals in sports. For example, the website FiveThirtyEight uses Elo ratings to rank and make predictions regarding NBA and NFL games.
Elo ratings are very popular because they are easy to calculate and easy to understand. Basically, each player’s rating starts with the same baseline value, such as 1500, which is then modified according to how the player scores as compared to all the other players for a given round. If a player scores well, their rating goes up, and vice versa. I provide more of the dirty details in the footnotes.2 But for now, let’s get right to the results.
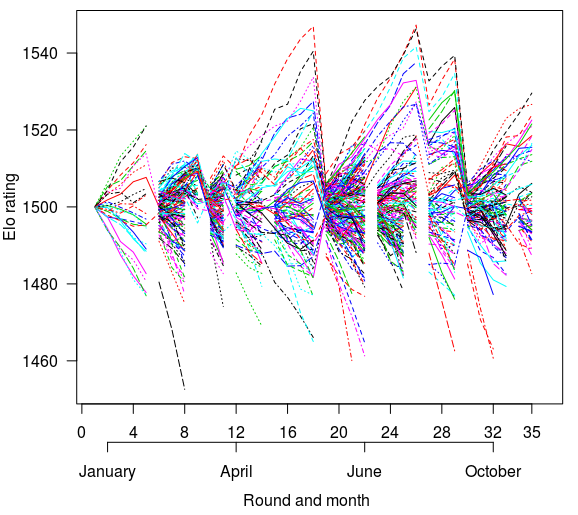
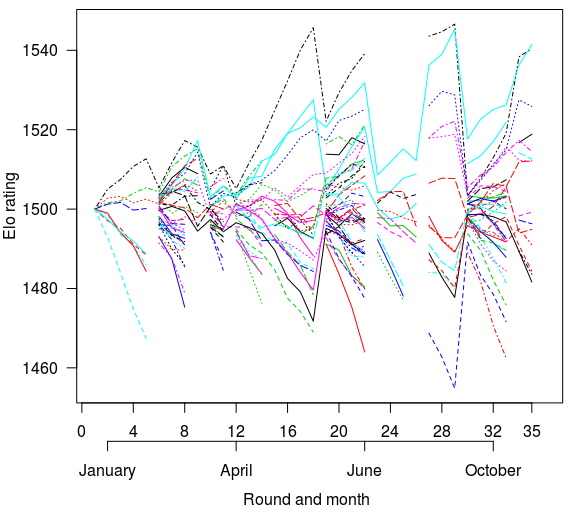
I have calculated Elo ratings for the 2017 MPO and FPO seasons. These ratings include the 595 MPO players and 104 FPO players that competed in PDGA Majors and NTs (35 total rounds). The figures show how the ratings of all 595 and 104 players, respectively, changed over the 35 rounds. They are pretty, but you cannot really learn anything from them.


For more clarity, I also generated tables of the top 25 rated players. I ranked them based on the harmonic mean of their average, maximum, and season end ratings, but the tables are also sortable by all four measures. Each of these ratings has value and tell you something worthwhile. But why focus on the harmonic mean? Because it is more sensitive to lower values and, therefore, penalizes players for not being consistent (mean), good (maximum), and/or a strong finisher (season end).
You probably recognize some of the players on these tables. At the top of the MPO ranking is, of course, Ricky Wysocki, who had the consensus “best” season. He had both the highest mean and end of season rating. Close behind is Paul McBeth, who had the highest maximum rating of the season after his transcendent comeback in the final round of the European Open (sorry Gregg Barsby!). Unfortunately, his struggles early on at the USDGC hurt his mean and end of season ratings.
| Player | Mean | Maximum | End Of Season | Harmonic Mean |
|---|---|---|---|---|
| Richard Wysocki | 1515.6 | 1533.3 | 1524.8 | 1524.5 |
| Paul McBeth | 1515.4 | 1534.0 | 1523.1 | 1524.1 |
| Simon Lizotte | 1512.0 | 1529.3 | 1515.7 | 1518.9 |
| Philo Brathwaite | 1509.8 | 1524.3 | 1518.0 | 1517.3 |
| Devan Owens | 1509.1 | 1523.7 | 1518.6 | 1517.1 |
| Nathan Sexton | 1508.2 | 1521.0 | 1521.0 | 1516.7 |
| Nathan Doss | 1510.3 | 1526.7 | 1509.3 | 1515.3 |
| Chris Dickerson | 1509.9 | 1520.2 | 1515.7 | 1515.3 |
| Kyle Crabtree | 1509.4 | 1516.4 | 1516.0 | 1513.9 |
| Gregg Barsby | 1507.1 | 1522.4 | 1512.2 | 1513.9 |
| Jeremy Koling | 1509.0 | 1519.2 | 1512.3 | 1513.5 |
| James Proctor | 1506.5 | 1515.9 | 1515.9 | 1512.7 |
| Michael Johansen | 1507.3 | 1520.4 | 1510.2 | 1512.6 |
| Austin Turner | 1507.2 | 1518.0 | 1512.4 | 1512.5 |
| Eagle McMahon | 1508.8 | 1522.4 | 1505.5 | 1512.2 |
| Paul Ulibarri | 1507.2 | 1519.4 | 1509.8 | 1512.1 |
| Zach Melton | 1506.6 | 1514.3 | 1513.0 | 1511.3 |
| Barry Schultz | 1506.8 | 1513.5 | 1513.5 | 1511.3 |
| Cameron Todd | 1505.1 | 1513.4 | 1513.4 | 1510.7 |
| Joshua Anthon | 1506.7 | 1516.9 | 1505.4 | 1509.7 |
| James Conrad | 1504.5 | 1517.7 | 1505.9 | 1509.3 |
| Robert Lockwood | 1505.6 | 1511.2 | 1511.2 | 1509.3 |
| Andrew Fish | 1505.9 | 1510.8 | 1510.0 | 1508.9 |
| Seppo Paju | 1505.0 | 1510.2 | 1510.2 | 1508.5 |
| Håkon Kveseth | 1505.9 | 1510.8 | 1508.7 | 1508.4 |
At the top of the FPO ranking is Catrina Allen, which came as a bit of a surprise to me. Paige Pierce had the highest maximum and mean rating, but Catrina’s hot play at the Pittsburgh Flying Disc Open and the Hall of Fame Classic propelled her season end rating and harmonic mean above Pierce’s. For both MPO and FPO, ratings fall off a little after the top two players.
| Player | Mean | Maximum | End Of Season | Harmonic Mean |
|---|---|---|---|---|
| Catrina Allen | 1514.2 | 1533.1 | 1533.1 | 1526.8 |
| Paige Pierce | 1515.9 | 1533.6 | 1529.3 | 1526.2 |
| Sarah Hokom | 1510.5 | 1522.0 | 1522.0 | 1518.1 |
| Valarie Jenkins | 1508.0 | 1519.6 | 1515.6 | 1514.4 |
| Jennifer Allen | 1506.2 | 1514.6 | 1514.6 | 1511.8 |
| Lisa Fajkus | 1507.2 | 1515.6 | 1510.5 | 1511.1 |
| Elaine King | 1508.0 | 1512.5 | 1511.3 | 1510.6 |
| Jessica Weese | 1506.0 | 1513.6 | 1508.9 | 1509.5 |
| Melody Waibel | 1502.2 | 1509.1 | 1509.1 | 1506.8 |
| Hannah Leatherman | 1503.2 | 1507.8 | 1507.8 | 1506.3 |
| Ellen Widboom | 1502.3 | 1509.9 | 1505.6 | 1505.9 |
| Nicole Bradley | 1503.4 | 1507.5 | 1506.9 | 1505.9 |
| Ragna Bygde Lewis | 1503.4 | 1506.7 | 1506.7 | 1505.6 |
| Karina Nowels | 1502.2 | 1508.5 | 1502.9 | 1504.5 |
| Madison Walker | 1501.5 | 1504.4 | 1504.1 | 1503.3 |
| Rebecca Cox | 1499.6 | 1505.0 | 1505.0 | 1503.2 |
| Kristin Tattar | 1500.4 | 1504.1 | 1504.1 | 1502.9 |
| Eveliina Salonen | 1502.8 | 1508.3 | 1497.2 | 1502.7 |
| Vanessa Van Dyken | 1500.2 | 1503.7 | 1502.8 | 1502.3 |
| Henna Blomroos | 1501.5 | 1502.7 | 1502.3 | 1502.2 |
| Zoe Andyke | 1500.9 | 1504.2 | 1501.2 | 1502.1 |
| Stephanie Vincent | 1501.6 | 1502.1 | 1502.1 | 1501.9 |
| Heather Zimmerman | 1501.2 | 1502.0 | 1502.0 | 1501.7 |
| Melodie Bailey | 1500.5 | 1503.4 | 1500.8 | 1501.6 |
| Michelle Frazer | 1500.9 | 1501.9 | 1501.9 | 1501.5 |
If you compare these ratings to those given by the PDGA, you will see a lot of consistencies. This makes sense because there are some conceptual similarities between PDGA player ratings and Elo ratings. For example, both use standardized round scores in their calculations. PDGA ratings use Scratch Scoring Average (SSA) and Elo ratings use the scores and ratings of other players in the round (see details below).
However, generally speaking, Elo ratings are much easier to calculate and one can quantify ratings for any tournament for which the scores exist, whether or not SSAs are available. This means we can generate ratings for players all the way back to the 1984 Pro Worlds (the earliest tournament data available on the PDGA website). As I generate these 20+ years of ratings I plan to improve upon my estimation of what is called regression to the mean,3 which controls for random fluctuations in performance that may be the result of many factors, the most common of which is small sample size (fewer rounds played).
Moving forward, I think these 2017 ratings provide a nice starting point for predicting future performance and generate some interesting questions. For example, can Nate Sexton translate his strong finish (his max ratings were his season end ratings) in 2017 and make moves on the dominant players? How quickly can any up and comers, like Kevin Jones, James Conrad, and Lisa Fajkus shoot up the ranks? We’ll have to wait and see.
The development of Elo ratings is one means of analytics that can enhance our understanding of the sport and provide an ample foundation upon which to explore it further. As soon as the 2018 season starts later this month, I will continue calculating Elo ratings for all participating players and expand the ratings to include all Disc Golf Pro Tour tournaments.
The method behind these ratings was first developed by Arpad Elo, a physics professor, who wanted a quantitative way to compare chess players. ↩
Methods: The Elo rating equation is: Elo Rating=PR+K*(S-(2*ES/N), where PR = previous rating, K = K-factor, S = round score, ES = expected score (based on other players competing in the same round), and N = number of players. K is a parameter that controls the volatility in ratings. Bigger K values mean more volatility. The K-factor I used was 20, which is a value that works well in a variety of sports. The 2*ES/N portion is modified from the classic Elo rating equation to deal with the fact that disc golf is not a one-on-one sport like chess (see: Building a rating system and Building a modified Elo rating system). For the first round of competition, when there was no PR, I used a baseline value of 1500. The baseline value can be anything you want, chess uses 1000, and it doesn’t really change your interpretation. I chose 1500 because it is commonly used for other sports. I extracted all data from the PDGA website. ↩
I did include an estimate of regression to the mean when calculating the 2017 ratings, but my estimate will be more accurate when data from more years are included. ↩