Patterns in terms of how the top pros are successful challenge commonly held adage
March 8, 2018 by Aaron Howard in Analysis with 0 comments

The Open division winners at the Las Vegas Challenge and the Memorial Championship, the first two big events of the season, did so by having dominant long distance accuracy and relatively average putting performances from inside the 10-meter circle. But what is perhaps even more interesting is that this pattern holds true for players beyond just the winners. Indeed, it seems to be a pattern that holds true across years because those players that finished closer to the top in 2017 and 2018 at The Memorial demonstrated keen accuracy from the tee and fairway.1
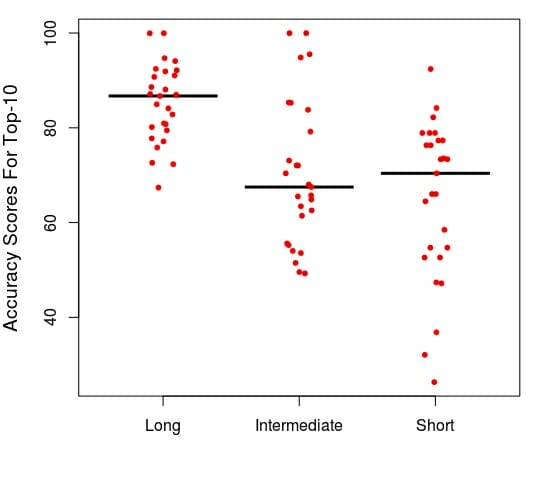
To reach this conclusion, I quantified the relationship between how players finished (place) in the 2018 Las Vegas Challenge, and the 2017 and 2018 Memorial Championship, and their long, intermediate, and short distance accuracies. All of the data are from UDisc Live. The major patterns in these data can be seen in the plot below that shows what I call long, intermediate, and short distance accuracy scores for players that finished in the top-10 of these three tournaments. The long distance scores reflect players’ abilities to hit fairways, greens in regulation, and park holes. The intermediate distance scores reflect players’ abilities to scramble and hit circle 2 putts. Short distance scores are based on circle 1 putting.2 The mean score for each distance is 50 and the maximum score is 100.

For long distance accuracy, the median (middle) score for top-10 players was 87 and no one had a score even close to 60, which indicates that top-10 finishers were well above average (50) in this statistic. Paul McBeth’s score from the 2017 Memorial Championship is a good example. It was 100 and he, of course, won the tournament. For further reference, the winner of the Memorial this year, Simon Lizotte, had a score of 100, as well. The data points are more scattered for intermediate than long distance and the median score is 67, meaning that players in the top-10 still did well in this category. For short distance accuracy, the scores are spread even more, with a median of 70 and a minimum value of 26. This means that some players did significantly worse than average in terms of circle 1 putting and still make it into the top 10.
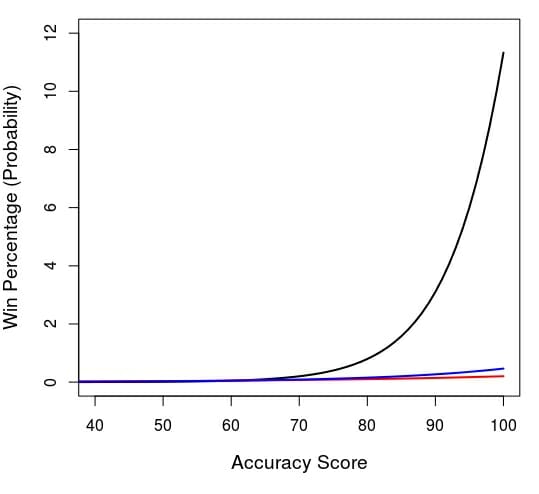
The large variance in the short and intermediate scores as compared to those for long distance accuracy indicate their proportionate lack of importance as predictors of success in these events. To further illustrate this, I generated a model3 that calculates win percentage (probability) by short, intermediate, and long distance accuracy score. What you see in the plot is that win percentage increases the most as long distance accuracy goes up and the least as short accuracy increases. A player with an intermediate or short accuracy of 100 does not even approach a 1%-win percentage, but an individual with a long distance accuracy score of 100 is well over 10%. This means accuracy from longer distances was far more predictive of success.

It is critical to mention some of the limitations of these data. One such limitation is the relative crudeness4 of the statistics. For example, the intermediate accuracy scores do not include some measures of what one would think of as intermediate distances, such as second throws on par 4s or 5s. And the short distance scores do not control for length of circle 1 putts. This is important because circle 1 putting percentages are likely inflated somewhat by those players that take more shots to reach the green and, therefore, often have shorter upshots and putts on average. In short, if specific location and distance data between each shot was available this, and similar analyses could be refined further.
A second potential limitation comes from the style of courses in play at each of these events, given that they are generally open, lacking in an abundance of vertical obstacles, like trees. The differences between more open and more wooded courses could certainly lead to some variance.
Despite the limitations, what meaning can we extract from these results? Well, perhaps for open courses, likes those at the Las Vegas Challenge and Memorial Championship, they mean that the old saying is wrong. Instead, it should go “you drive for dough and putt for show”! The next big tournament, the Waco Annual Charity Open will be an interesting test case for this pattern, as it is a course with a front nine that is relatively wide open—but slightly less so than the Las Vegas and Memorial courses—and a back 9 that is heavily wooded. Perhaps the back nine results will dictate the need for skills very different from those demonstrated by players that have dominated the podium so far this season. Once that tournament is complete, we will have two tournaments worth of data from both Waco and the 2016 and 2017 Vibram Open on the wooded Maple Hill course with which to examine this pattern and compare it to these results from the LVC and The Memorial.
We do not have statistics available to assess the 2017 Gentlemen’s Club Challenge, which was the former name of the Las Vegas Challenge. ↩
I used a statistical procedure called factor analysis to determine which variables group together the “best”, or correlate well with each other. This correlation suggests there may be some underlying factor (hence the name) that influences all highly correlated variables. For example, fairways hit, holes parked, and circles 1 and 2 in regulation are all highly correlated with each other because they are indicative of long distance accuracy. ↩
An ordered logit regression, for those of you who care. All three scores were statistically significant predictors of success. The coefficients and p-values were: long scores = -0.14, 1.23×10-78, intermediate scores = -0.06, 6.9×10⁻²⁸, and short scores = -0.035, 5.73×10⁻¹⁷. The negative coefficient values mean that place decreases (approaches 1st place) as score increases. ↩
Here, we are using the word “crudeness” in the context of statistics, meaning it refers to data that, while definitely possessing quality explanatory power, could also possess more detail in an ideal setting where collection of the data could be refined; it does not refer to the more unpleasant meanings “crudeness” can take. UDisc Live’s collection of data is invaluable. ↩