A Look Back At The 2019 Season Through Deviations
November 13, 2019 by Aaron Howard in Analysis with 0 comments
The 2019 disc golf season is behind us, which means it’s time for us to look back and figure out which players had the best season. I am me, so of course that means I am going to do this statistically. However, I’ve measured the statistical best before, and I don’t want to do just the same old thing. So, I am also going to look at who had the “luckiest”1 2019 season.
The best and luckiest are non-independent from each other, really, because you need to be able to measure skill or performance in some way and then measure how players’ results deviate (luck) from skill (best).
To measure skill, I developed a statistical model that used UDisc Live data going back to its inception to explain players’ final scores in tournaments,2 and the model works very well for both the MPO and FPO fields. The UDisc stats explain about 86% of the variation in scores. That is a lot of explained variance! And in layman’s terms basically means that if you throw the disc better (hit greens in regulation and putts, etc.) you score better.
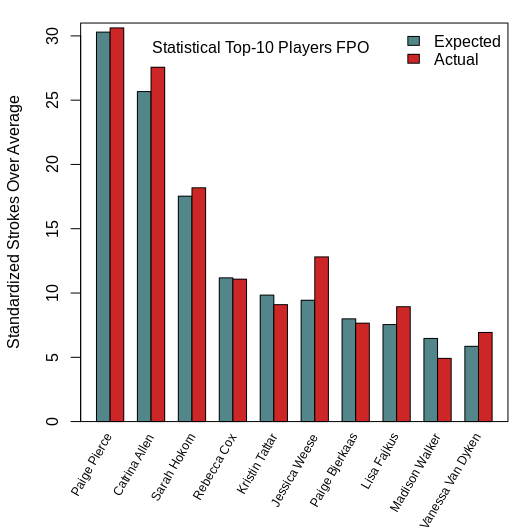
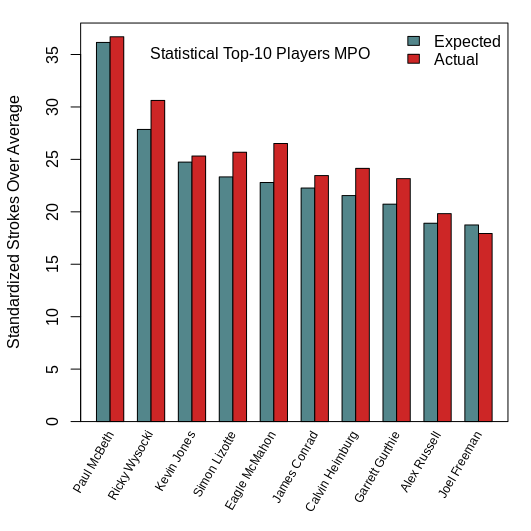
It should surprise no one that Paul McBeth and Paige Pierce did the “best” according to the models for MPO and FPO, respectively. They have the highest number of standardized strokes gained over average.
“Standardized” means we put all of the scores on the same scale, which is important because we want to be able to combine data across all tournaments even though they have different par scores. “Over average” just means that we standardized scores using the average score for each tournament as the baseline value.
For further reference, one unit of standardized strokes equals, on average, about 15 actual strokes for the MPO model. So, on a per tournament scale, Paul McBeth outplayed Ricky Wysocki (the second best player according to the model) by about 3.4 strokes. Interestingly enough, the pattern holds for the FPO division, too. Paige Pierce out shot Catrina Allen by about 3.5 strokes per event.
But the plots above have two bars per player. The first bar is the expected (or predicted) number of standardized strokes according to the model and the second bar is the actual number of standardized strokes over average. And this is where the idea of “luck” comes into play. Presuming that the UDisc stats capture a vast majority of the skills players display on the course (which seems probable given the amount of variation in scores they explain), the difference between the actual and expected standardized strokes over average is a measure of random effects, or “luck,” on scores. Pretty cool!
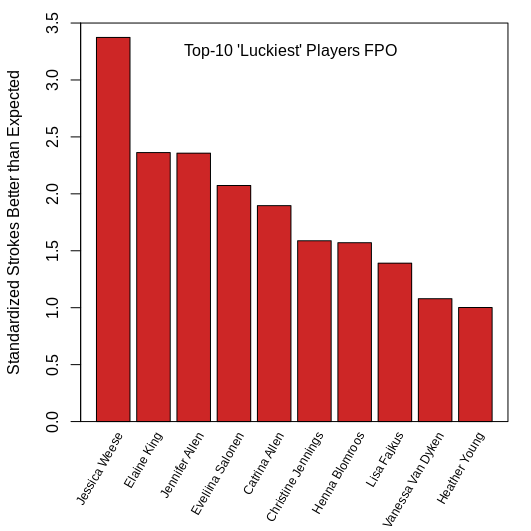
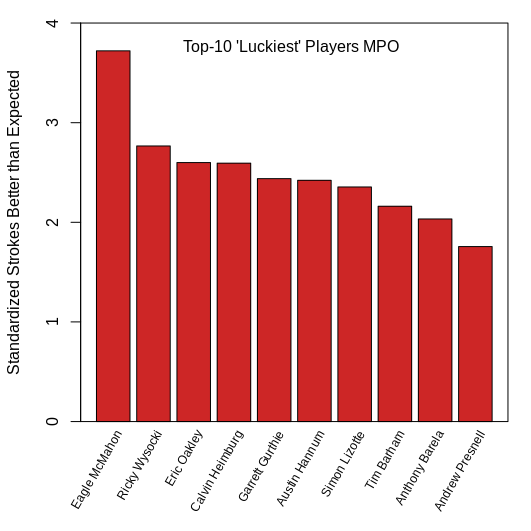
According to the model, the MPO player with the most “luck” was Eagle McMahon. He had 3.7 standardized strokes (or throws) of unexplained success on the course. On the FPO side, Jessica Weese had the most “luck,” with 3.4 strokes difference between her actual and expected standardized scores.
One thing you hopefully notice right away is that a lot of good players top these “luckiest” player lists. I think there is some “luck is when preparation meets opportunity” happening here. These are not rate stats, so the players that play more tournaments — have more opportunities — are going to have higher values. Also, I don’t think this difference between expected and actual scores is reflective of only random processes. I think there is some skill that the UDisc stats do not capture.
However, let me be clear. I think the majority of the difference I mentioned above does reflect randomness. One way to test this idea is to see how repeatable these values are between years. If the difference between the actual and expected standardized scores are due to some repeatable, underlying skill, the values for 2018 would be similar to or at least predictive of the 2019 values.
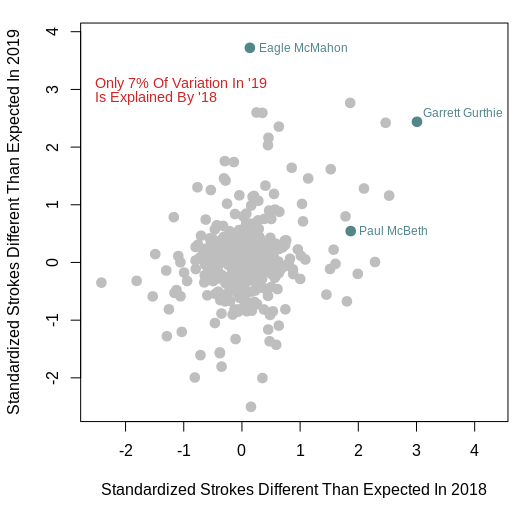
When I compare the 2018 and 2019 values, I find that there is some predictability in the MPO field, but not much. Only 7% of the variation in 2019 values can be explained by 2018 values. For example, Eagle McMahon’s value was the highest in 2019 at 3.7, but his number in 2018 was approximately 0. There is even less predictability in the FPO data. Only about 1% of the variation in 2019 is explained by 2018.
There are some players that buck this trend, such as Garrett Gurthie, who has consistently scored better than his UDisc data suggests he should. This made me think that UDisc wasn’t able to capture the benefits of his ability to throw the disc far, but counter to this idea is Elaine King on the FPO side. She has had positive “luck” in both 2018 and 2019, but she is not considered a masher of the disc. Therefore, either I am wrong about Gurthie, or more than one unmeasured factor can influence this measure of “luck.” Gurthie does perform better on technical courses than his reputation suggests he should
All of this finally leads us back to the question I posed in the title of this article. Is it better to be “lucky” or good? Hopefully, the answer is as clear to you as it is to me. It is way better to be good.
Eagle McMahon, who had the most “luck” according to my model, was still the fifth best player according to my expected strokes over average estimate, and across-the-board players actual and expected strokes above average are very close to each other. Only a small portion of scores are not currently explainable. So, do not fret, your favorite player on tour is not “lucking” their way to success, they are still really good at disc golf.
I use quotes here because I am not able to 100% dissociate luck from skill, but I feel pretty confident that I can get a pretty good idea of both. ↩
Using UDisc data for all MPO and FPO players and tournaments going back to 2016, I ran multiple linear regression where standardized (z-transformed) score was the response variable and fairway hit, circle one and two in regulation, scramble rate, circle one and circle two putting, and OB rate were the explanatory variables. I ran separate regressions for MPO and FPO. The percent variation explained metric that I used was adjust R2. ↩

