Is it fact or fiction?
October 25, 2018 by Aaron Howard in Analysis

The 2018 season is now complete, which is a bummer. But it also means we have an opportunity to look back and see if we have learned something over the year.
One concept I want to examine in the context of the 2018 season is parity. You have probably heard many disc golf pundits this year say something like “the field is wide open” or “so many different players can win this tournament.”1 Now, perhaps some commentators are saying these things as a way to get viewers excited about coverage, but what they are in fact implying is that parity is high, and I think those statements reflect a consensus2 opinion of those close to the sport: 2018 was a year of great parity.
Well, my question is, do the data support this take on the season? Is parity high?
To answer this question we must compare the 2018 season to prior seasons. I chose to compare the 2018 MPO season to all seasons going back to 2003, which was the first year of National Tour events, or the start of the “National Tour Era.”3
The first thing I looked at across all 16 years (2003 – 2018) was the number of unique tournament winners. If parity in a season is high, you would expect a lot of different, or unique players, to win tournaments. Below is a plot looking at the cumulative number of unique winners across each season. The values displayed are cumulative, so after the first tournament of a given year, the value plotted for that given year is always one. If the second tournament has the same winner as the first, the value remains one, if it has a different winner, the value is 2, and so on and so forth.
For example, in 2018 (red line), the first tournament included was the Las Vegas Challenge. Eagle McMahon won it and the first value for the 2018 season was one. The second tournament was the Memorial Championship, which Simon Lizotte won. He was a new winner (aka not Eagle McMahon), so the second value was two. Across the 18 tournaments of the 2018 season included in the dataset there were 8 unique winners.
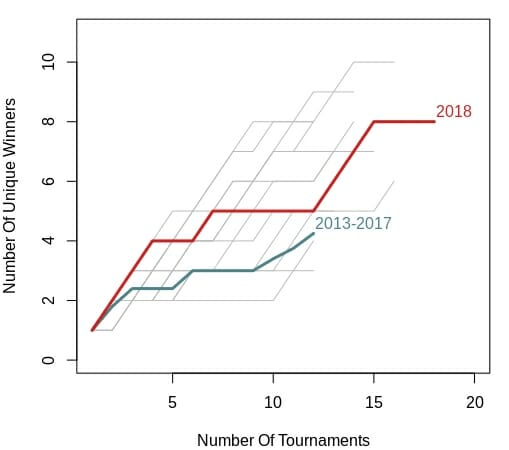
If you compare how the 2018 line increases compared to all of the other years (gray lines) it seems to be in the middle of the road. Parity was neither high nor low. I also included the average values for the previous five years (2013–2017) in teal, and 2018 does appear to have slightly more parity, especially through portions of the middle of the season.
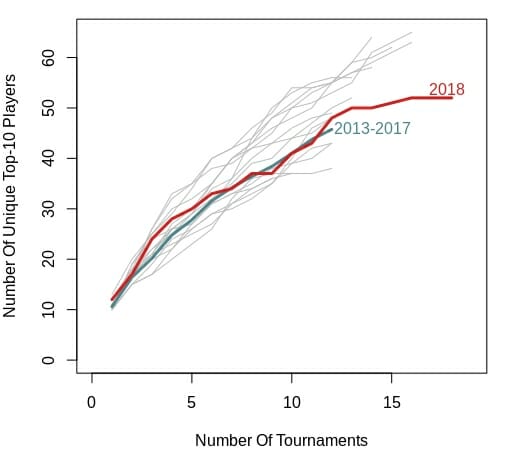
However, winners are a select few and by looking at only winners we may be missing trends regarding other players that could have won tournaments. To address this, I also made a plot of unique top 10 finishers. However, the results do not really change. Again, 2018 seems to be middle of the road, and mirrors the 2013–2017 mean values pretty closely.
One issue that you may be noticing is that there are different numbers of tournaments for each year. Some of the years include as few as nine tournaments. This year includes 18. This difference could bias our results because, generally speaking, more tournaments means more opportunity for new players to enter the top 10.4
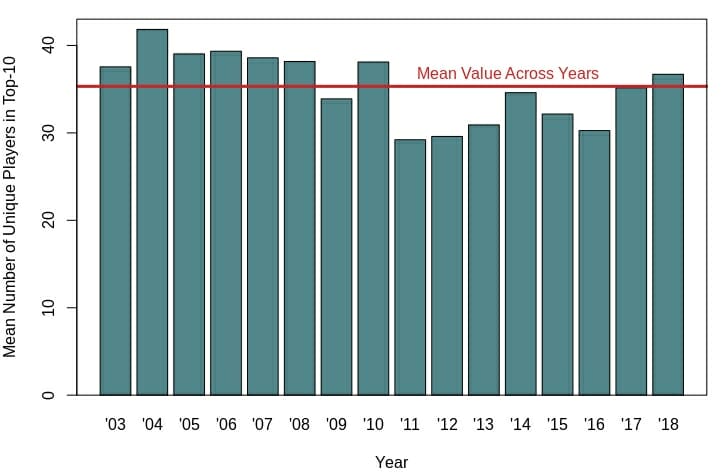
So, I used something called a bootstrapping method5 to quantify the number of unique top 10 finishers while controlling for the different sample sizes, or number of tournaments, per year.
This season has slightly higher parity than last year, and greater parity than every year going back to 2011. This increase in parity as compared to recent years may help explain why those within the disc golf media are exclaiming the parity of the 2018 season. However, before 2011, parity was pretty much equal to or higher than it is now. Overall, 2018 is pretty close to the mean value across all 16 years in the dataset.
Beyond recency bias, why may those within the disc golf community think parity is so high? It could have to do with the increased amount of disc golf coverage available. More tournament rounds are being filmed and made available on the internet every year. This increased exposure could make it appear that there are more players in the hunt to win tournaments than ever before.
However, the data show that 2018, in regards to parity at least, was just another average season.
This includes the most recent coverage from the DGPT Finale. Heck, I’ve even invoked the idea of parity in past articles. ↩
Note that consensus means a general agreement and is not a synonym of unanimous, which means a full agreement. ↩
For the years 2003 through 2017, I included only results from the MPO fields for Majors and NTs. For 2018, I included the MPO fields for Majors, NTs, and all DGPT events except the DPGT Finale because it has a unique format that makes comparisons with other tournaments inappropriate. ↩
This bias is the result of a term called sampling effort, and is a relatively well-understood phenomenon, especially by those that study the diversity of organisms on our planet. ↩
Bootstrapping is random sampling with replacement. More specifically, I randomly sampled 9 tournaments from each year 1,000 times and estimated the mean number of unique top 10 finishers for those random samples. The idea here is that it keeps each year’s sample size the same (nine), but still includes all tournaments for all years in the analysis. A more simple way to deal with the uneven sample size would have been to use only the first nine tournaments in every year, but then we would have not included valuable information from the additional tournaments. The bootstrapping method allows us to control for differences in sample size (number of tournaments per year) without throwing out data. ↩