Who comes close? Not many...
July 18, 2018 by Aaron Howard in Analysis with 0 comments

Paul McBeth played, to say the least, incredibly well at the 2018 Great Lakes Open. We all know many of the highlights: his 18-under par 45 second round was rated 1108, he won by nine strokes, and he did not miss a circle one putt through three rounds. But I think the more interesting question to ask is how McBeth’s performance compares to other player’s performances at other tournaments, and this is where statistics become very useful. I compared McBeth’s 2018 Great Lakes Open statistical performance to all of the other’s available on UDisc Live.1 More specifically, I quantified the tournament performances that were most similar to McBeth’s and tried to determine if any other performances were as amazing as his.
To find the most similar performances, I generated a similarity score,2 which found the players that had statistics at specific tournaments that best “matched” McBeth’s GLO statistics. The top-10 most similar performances are shown in the table below (note that lower similarity scores mean that rounds are more similar to each other). It should be no surprise to you that those with similar statistical performances placed well. The lowest place in the 10 most similar performances was Peter McBride’s 10th place finish at the 2018 Waco Annual Charity Open, the second highest place was fourth. The most comparable performance was Ricky Wysocki’s victory at the 2016 Green Mountain Championship. Like McBeth, Wysocki’s play was dominant. He won by six strokes, which was equivalent to the stroke difference between second place and 14th place. He also hit a ton of fairways and greens and only missed a single Circle 1 putt.
| Name | Place | Event abv. | Year | Similarity Score | Fairway Hit | Parked | Circle 1 Reg. | Circle 2 Reg. | Scramble | Circle 1 Putts | Circle 2 Putts | OB Rate |
|---|---|---|---|---|---|---|---|---|---|---|---|---|
| Paul McBeth | 1 | GLO | 2018 | 0 | 81 | 19 | 63 | 87 | 86 | 100 | 43 | 1.9 |
| Ricky Wysocki | 1 | GMC | 2016 | 1.7 | 76 | 20 | 48 | 80 | 82 | 98 | 44 | 3.7 |
| Nate Sexton | 4 | NHM | 2017 | 2 | 80 | 17 | 58 | 75 | 89 | 94 | 50 | 0 |
| Simon Lizotte | 1 | Memorial | 2018 | 2.9 | 86 | 22 | 65 | 83 | 75 | 92 | 40 | 6.9 |
| Peter McBride | 10 | WACO | 2018 | 3.2 | 78 | 20 | 46 | 76 | 85 | 94 | 38 | 5.6 |
| Ricky Wysocki | 1 | J'boro Open | 2018 | 3.6 | 77 | 11 | 61 | 74 | 86 | 93 | 38 | 1.9 |
| Eagle McMahon | 2 | NHM | 2018 | 3.6 | 81 | 29 | 54 | 77 | 83 | 98 | 33 | 1.9 |
| JohnE McCray | 4 | WACO | 2018 | 4 | 73 | 20 | 59 | 74 | 79 | 91 | 50 | 7.4 |
| Nikko Locastro | 3 | GLO | 2018 | 4.1 | 72 | 22 | 50 | 72 | 100 | 96 | 33 | 0 |
| Nate Doss | 1 | GMC | 2017 | 4.2 | 86 | 26 | 63 | 86 | 90 | 92 | 28 | 1.4 |
| Michael Johansen | 2 | GMC | 2017 | 4.3 | 81 | 14 | 46 | 76 | 88 | 97 | 60 | 2.8 |
However, Wysocki’s statistical performance at the 2016 GMC, along with all of the other top comparable rounds, weren’t quite as good as McBeth’s. For example, Wysocki hit fewer fairways, fewer greens, and threw disc’s OB at a higher rate than McBeth. So, the next logical question is: has anyone in the UDisc Live era performed as well as McBeth did at the 2018 GLO?
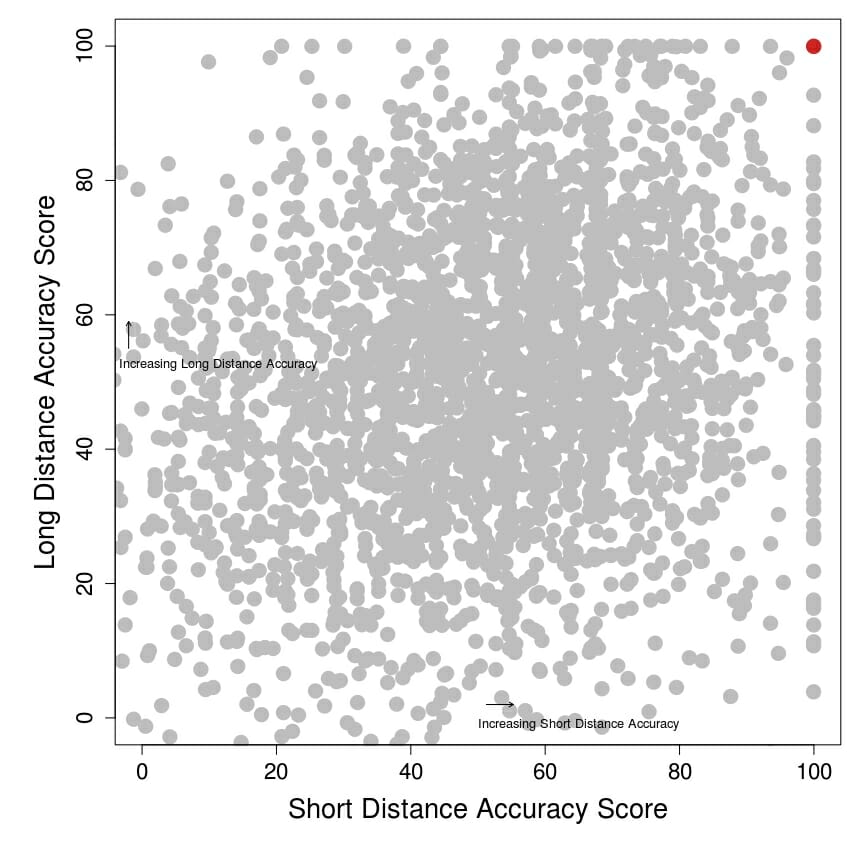
To answer this question, I calculated mean values for my handy accuracy scores. As a quick refresher, there are three of them: one for long distance, one for intermediate distance, and one for short distance accuracy. The highest possible value a player can have is 100, and the mean value is 50. McBeth’s scores for the GLO were 100, 80, and 100, respectively. These mean that his long and short distance accuracies were the best (he did hit all of his Circle 1 putts), and his intermediate score was well above average. McBeth’s mean score was 93, and the best value for all tournament performances in the UDisc Live era.3 This is amazing, given that the dataset is composed of 27 tournaments and 1,222 unique players, and probably best understood by looking at the plot below of long versus short distance accuracies. McBeth’s value is the red one that stands out in the top right corner.

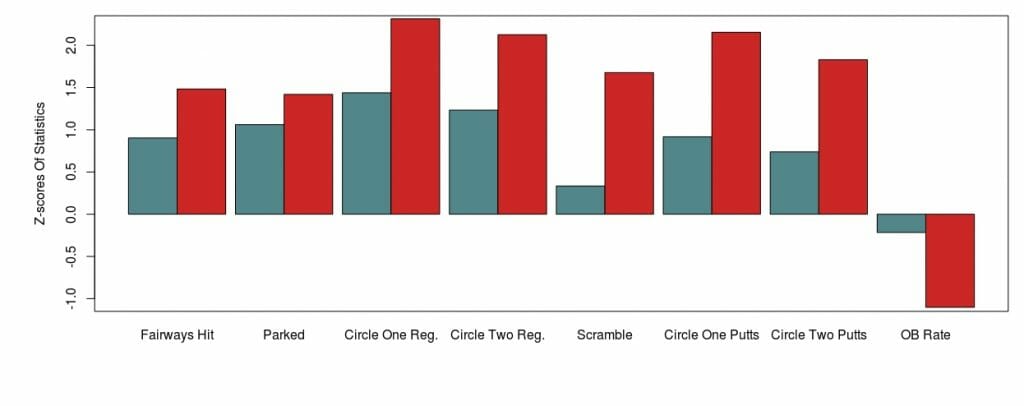
When McBeth is at his best some say you can only compare him to himself. Well, just like any athlete, McBeth isn’t always at his best, but it is still a fun exercise and sheds some light on how his GLO performance was statistically similar to and different from his other tournaments. So, I took the average z-scores of his statistics across all the events he played in and compared them to the z-scores for his GLO performance. McBeth has been above average almost across the board (see the plot below). For example, his Parked z-score of ~1 for all events indicates that he is one standard deviation above average in his rate of parking drives. However, at the 2018 GLO, McBeth was much better at pretty much everything, except his rate of throwing OB.4 What stands out to me the most is his Circle 1 in Regulation score of almost three. Without hyperbole, being three standard deviations above average is insane. For comparison, the SATs have a standard deviation of around 200 points, with an average score of 1,000. Three standard deviations above average is a perfect score of 1,600. So, McBeth’s Circle 1 in Regulation rate was like getting a perfect score on the SATs.

In sum, Paul McBeth had one of the best tournaments on record. It was exhilarating to watch and perhaps even more fun to analyze. His performance had so many statistical anomalies that I couldn’t mention all of them. Perhaps I will write more about it in the future. But what I am looking forward to is his next tournament (and the one after that, and the next one…), so I can see if he keeps it up or if someone else rises to the challenge and somehow tops McBeth’s historical weekend.
This includes all completed tournaments, excluding Tour Championships, from 2016 through the 2018 GLO. The dataset is composed of 27 tournaments and 1,222 players. ↩
To calculate similarity scores, I generated z-scores for Fairway Hits, holes Parked, reaching Circle 1 and Circle 2 in Regulation, Scramble rate, Circles 1 and Circle 2 putting, and OB Rate. Then, I calculated the squared differences between McBeth’s 2018 GLO statistics and statistics for all other players in all other tournaments available on UDisc Live. Then, I summed the square differences for each player in each tournament, which is the similarity score. The smaller the squared difference, or similarity scores, the more similar the player’s performance was to McBeth’s. In other words, the player’s statistics were more similar to McBeth’s statistics. ↩
If you are curious, the second best mean score was a 92.4 and accomplished by Michael Johansen at the 2016 Vibram Open. ↩
McBeth’s closest comparable tournament was the 2016 Ledgestone Open, which he won. It was ranked 27th on the list of comparable player tournaments. ↩