October 1, 2018 by Aaron Howard in Analysis with 0 comments

On the Jomez Pro coverage of the final round at the Delaware Disc Golf Challenge, Paul Ulibarri said that, “Paul McBeth is the Steph Curry of disc golf.” Then, my colleague at UWDG, Patrick Aubyrn, wrote a wonderful piece describing the Circle 2 putting show that McBeth and Ricky Wysocki put on in Delaware, comparing them to the “Splash Brothers” of the Golden State Warriors.
Well, I want to take a deeper dive into this comparison and see if it really holds water (splash!). First, you must understand the OG “Splash Brothers.” Steph Curry and Klay Thompson both play for the Warriors and are among the best shooters the NBA has ever seen. Man-oh-man can they hit 3s. In fact, they are the cornerstones of a dynasty in the Bay Area because, in part, they are so good at shooting.
What does being good at shooting 3s really mean though? Two things, they shoot and make a lot of them (high volume), and they help their team win (add value).
Back To Disc Golf
So, if Ricky and Paul are the “Splash Brothers” of disc golf, then they must do two things: make a lot of shots from deep, C2 or farther (high volume), and those shots must help them win tournaments (add value).
Let’s start with making a lot of shots from deep. For the purposes of this article, I am including C2 putts and throw-ins as shots from deep. This is pretty easy considering I have C2 putting percentages and throw-in rates from all tournaments on UDisc Live going back to 20161. It’s not totally easy, however, because generally C2 putting percentages and throw-in rates are on different scales.
To consider them on the same scale I standardized them both2, then I averaged the standardized values.
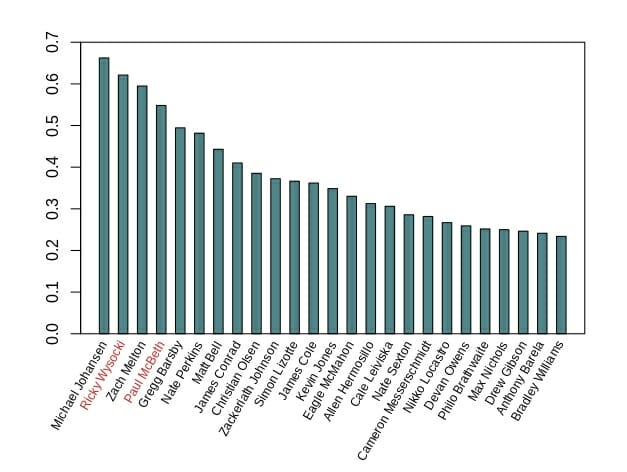
What you see in the plot is that both Ricky and Paul are in the top five. Pretty good! So, yes, they are making a lot of shots from deep. No surprise there. The real takeaway is that someday I should write about the number one player, Michael Johansen, and his short game.
The next, and more important, question is, do those many shots from deep help Paul and Ricky save strokes? This is a hard question to answer. Circle 2 putting percentage and throw-in rate are right in front of your face, but what they mean exactly for the scorecard is more challenging.
In a previous article, I explored the value of putting in strokes gained and lost. I am going to use an updated, and better, method in this article to value C2 putting for MPO players that competed at the 2018 DDGC. Instead of, to quote myself from the other article, just comparing, “how many of those [C2] putts an individual made as compared to the expected number made by the average player in the field,” I am also going to include the average value (strokes gained) for a made C2 putt at Delaware3.
In other words, I am comparing how players that hit C2 putts score relative to the entire field. This puts the value more in line with the true strokes gained concept developed for ball golf.
I used the same method for throw-ins as for C2 putting. The value of a throw-in was about 0.7 strokes, meaning that a player that had a throw-in, on average, scored 0.7 strokes better than average. However, throw-ins were very rare (average rate of 0.0076), so for the entire tournament players in the top ten only gained an average of 0.28 strokes. Not much value there, so we will move on.
Below is a plot with a lot of information, including strokes gained from C2 putting by top ten players for the entire 2018 DDGC. You should notice that Paul and Ricky outpaced the others in the top ten by quite a bit. The value they generated with their C2 putting performances was outstanding, relative to the field.
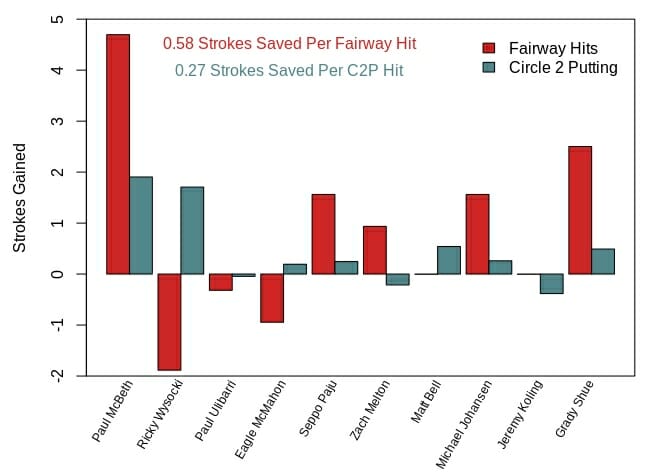
But hopefully you noticed the much larger red bars in the plot. They indicated strokes gained or lost by hitting fairways4. I couldn’t help myself and had to include these values. Why? Because the crux of this article is value. Remember one of the key aspects of being a “Splash Brother” is creating value, and, while C2 putting does create value, it does not create nearly as much as hitting fairways does.
On average, players that hit fairways save about 0.58 strokes per hit, which is much higher than the 0.27 strokes saved with C2 putts hit. This disparity explains, in part, why the magnitude of the red bars is larger than the blue bars. However, it does not explain all of the disparity. The other portion of the explanation is that players either hit fairways (or greens), or miss them on every hole. Circle 2 putts do not happen on every hole. So the frequency of each of these events plays an important role in creating value or losing it in the case of Ricky’s fairway hits.
You may be sick of hearing it, but long distance accuracy (hitting fairways, etc.) is more valuable than hitting greens. These data provide further evidence of that phenomenon.
In sum, Paul McBeth and Ricky Wysocki take and hit a lot of long distance putts, which saved them more strokes on the green in Delaware than all other players in the field. So, yes, in that regard I do feel comfortable calling them the “Splash Brothers” of disc golf.
Given the greater value generated (or lost) off the tee pad though, perhaps the nickname loses some of the luster that it provides to its NBA counterparts.
31 total tournaments. However, I only included players that had competed in at least 10 events because what I am measuring are sustainable skills, not aberrative performances over a small number of tournaments. ↩
Using z-scores. ↩
The equation for strokes gained from Circle 2 putting is SC2 = NIC2*SGC2*(PIC2-PFC2), where NIC2 is the number of C2 putts thrown by an individual, SGC2 is the average strokes gained for made C2 putts, PIC2 is the C2 putting percentage for an individual, and PFC2 is the mean C2 putting percentage for the field. This is where the “more challenging” part came in because I had to go through the data for each hole of the tournament (54 total) and determine how the scores for players that hit a C2 putt compared to the average score for the hole. ↩
And hitting C2 on par 3 holes. These values are calculated in the same way that the strokes gained from C2 putting and throw-ins are calculated. ↩