For two demanding courses, players will still need to stack birdies
September 5, 2018 by Aaron Howard in Analysis, Preview with 0 comments
If you’re like me and have been re-watching coverage of last year’s Green Mountain Championship in preparation for the 2018 PDGA Professional World Championship, then you’ve noticed it was a birdie fest. Nate Doss won with a 44-under par total, and he only won by two strokes over Michael Johansen. This then, begs the question, how low will players have to score in order to get a podium spot at Worlds this year?
The answer is low, very low. Over the past five years at Pro Worlds, MPO players that finished in the top three averaged, yes averaged, 1050-rated golf. FPO players averaged 970. If I consider that incredible play in conjunction with the prime scoring conditions at last year’s GMC, I get estimates of 49-under par total for MPO, and 11-under par total for FPO.1
In other words, MPO players will have to average almost 10-under par per round, and FPO players will have to average about 2-under par per round to even sniff victory.
These numbers are not anecdotal, and the process of calculating them resulted in some interesting findings, in addition to my predictions. So let’s go through the process and examine what I found.
Finding The SSA Needed For Worlds
First, I aggregated the data for the last five Pro Worlds (2013–2017), including round scores and round ratings. Using these data, I estimated SSA (scratch scoring average), which you may be familiar with, that represents the expected score for a 1000-rated player in any given round.2 I then determined the relationship between the scores of players that finished in the top three of these tournaments and their SSAs.
What is interesting here is that the scores and SSAs did not increase in a one-to-one linear fashion. For example in MPO, with every stroke increase in SSA, top three scores only increased by 0.82 strokes. This could mean many things, but one clear interpretation is that the top three players at Worlds generally play much better than your “average” 1000-rated player. It also points to the idea that top three finishers may be playing above their ratings in a way that those playing 1000-rated golf are not.
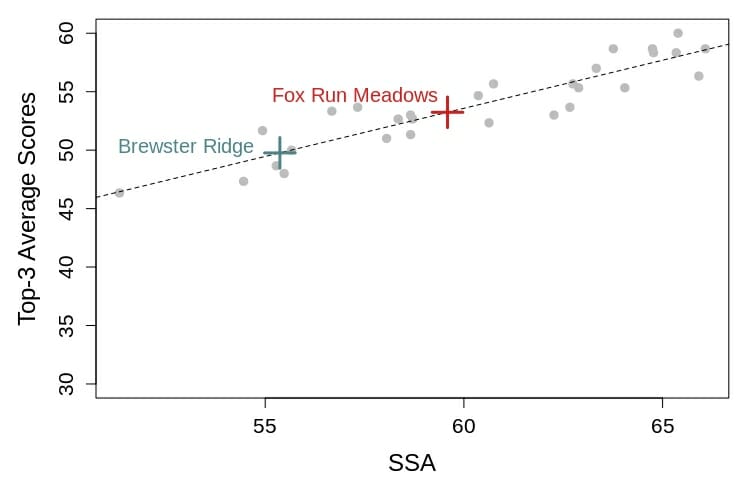
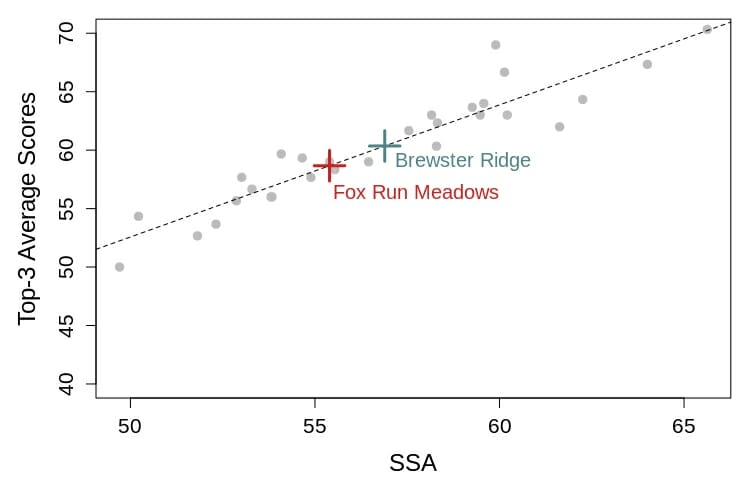
Second, I estimated SSA values for the two courses that are part of this year’s tournament, Brewster Ridge and Fox Run Meadows. I did it in the same way as described above for the five previous Worlds, but this time I used only data from the 2017 GMC. Unfortunately, the par score at both these courses increased by one from last year to this year, so I had to control for the influence of par value on my SSA estimates. This was also interesting as with each stroke that par increased, SSA only increased by about 0.6 strokes.3 This means that adding a stroke to par does not automatically mean you are adding a stroke to every player’s score. This could, perhaps, be the result of increased scoring opportunities that come with additional strokes added to a course.4
Finally, I used the SSA values I calculated for Brewster Ridge and Fox Run Meadows, and the relationship I quantified between top three scoring and SSA for past Worlds to estimate the round scores for top three finishers at Worlds this year.5 Then, I compared those predicted scores to par, took into consideration the number of rounds played at each course, and voila(!) I generated the 49-under par and 11-under par values.
The take-home message here is that I predict players are going to have to score extremely low to win Worlds. That is why, in part, I picked Paul McBeth, Paige Pierce, and Kevin Jones to do well in this event. They are players with the potential to go really low, and I hope they do because it will be fun to watch.
There are error bars around these estimates, but I did not quantify them because the math is tricky. Someday I will make an attempt. ↩
To estimate SSA, I did a linear regression of players scores in a round versus their rating, and used the best fit line generated by the regression to estimate the score for a 1000 rated player. ↩
For both MPO and FPO. ↩
If you are interested in this concept, I discuss it more in this article. ↩
More technically speaking, I plugged my estimate of each round’s SSA into the regression equation used to quantify the relationship between top three scores and SSA. ↩