Strokes gained and lost on the green proved influential in determining the FPO winner
March 20, 2018 by Aaron Howard in Analysis with 0 comments

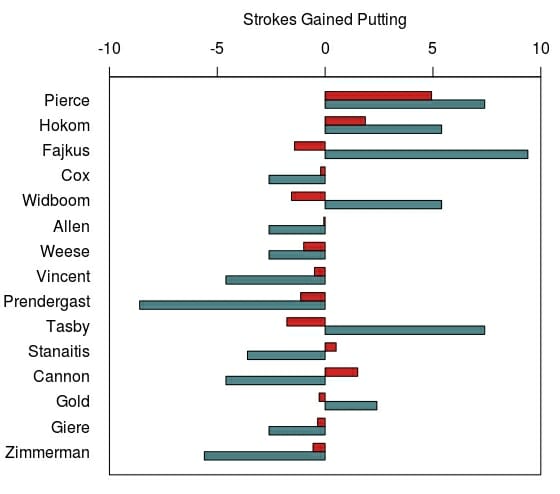
Over the past few weeks, I have built an argument for the importance of long distance accuracy over short distance accuracy when it comes to success at the highest profile professional tournaments. And that pattern did not really change in the FPO division at the Waco Annual Charity Open, where the top two players in long distance accuracy, Sarah Hokom and Paige Pierce, finished at the top of the standings. However, what did end up making a difference between these two competitors was their putting. Despite falling slightly behind in long distance accuracy, Pierce was able to seize the victory from Hokom by gaining more strokes over the field with accurate putting in the final round. Pierce gained 12.3 strokes, whereas Hokom only gained 7.3.
Strokes gained is a statistical concept that is well established in the PGA and started with putting. The idea is, simply, compare how many shots, or putts, in this case, an individual takes compared to the average player in the field. For last weekend’s WACO, I calculated the strokes gained statistic for both circle 1 and circle 2 putting in the FPO division, using UDisc Live’s statistics.
For circle 1 putting, I compared the number of putts each player took to the average for the field. However, to minimize the influence of other aspects of players games, such as long and intermediate distance accuracies, I removed circle 1 putts that occurred on holes that were parked inside 11 feet and came after circle 2 putts.1 In other words, I removed circle 1 putts that were tap-ins and, therefore, more indicative of skills other than putting.
For circle 2 putting, I compared how many of those putts an individual made as compared to the expected number made by the average player in the field.2
To illustrate these statistics, we need to look no further than the final round at WACO, where Pierce’s putter was on fire. She hit both of her circle 2 putts and was 89% from circle 1 resulting in over four strokes gained on the field in that round alone. However, she almost gave it all away with three circle 1 putts on the penultimate, fifth hole. Using the methodology described above, the field averaged 1.5 circle 1 putts on that hole, meaning that Pierce lost 1.5 strokes to the field on that hole alone. Fortunately though for Pierce, she only lost one stroke to Hokom, who needed two circle 1 putts to finish the hole. Hokom’s putting on the fifth hole was indicative of her struggles on the green all round. She required two circle 1 putts to finish out eight different holes in the final round, whereas she only two-putted on four holes in the first two rounds combined. This translated to only 69% from circle 1 and her losing almost five strokes to the field.
Before the final round, Hokom was gaining more strokes through putting than any other player, including Lisa Fajkus, who gained eight strokes throughout the tournament. But Hokom’s relatively poor performance in the final round dropped her strokes gained putting from over 12 to just 7.3, which ranked her third in the division. Pierce, despite her struggles on the fifth hole, increased her strokes gained by 55% in the final round from 8 to 12.3, catapulting her to first place in putting strokes gained and to the tournament win.
The equation for strokes gained from circle 1 putting is SC1 = NFC1-NIC1, where NIC1 is the number of circle 1 putts taken by an individual, excluding those taken on parked holes and after circle 2 putts, and NFC1 is the average of NIC1 for the entire field of players. ↩
The equation for strokes gained from circle 2 putting is SC2 = NIC2*(PIC2-PFC2), where NIC2 is the number of circle 2 putts thrown by an individual, PIC2 is the circle 2 putting percentage for an individual, and PFC2 is the mean circle 2 putting percentage for the field. Note that this is different than the equation for circle 1 putting. This difference is unavoidable because a missed circle 1 putt usually results in another circle 1 putt, but a missed circle 2 putt usually results in a circle 1 putt. In other words, throwing more circle 2 putts per round is not necessarily a bad thing, but attempting more circle 1 putts per round is almost definitely a negative. ↩